Visualize and monitor all your performance indicators in one solution
Access the latest KPI updates from your smartphone, computer, or shop floor displays to ensure effective monitoring and rapid response to performance gaps. Significantly reduce non-value-added time spent updating your metrics with fabriq’s automation tools, and create a standardized KPI tree that aligns all teams on your site.


30+mins saved per day per team leader
Real-time visibility of performance data
Better understanding of performance gaps
Tailored to the format of your operational indicators
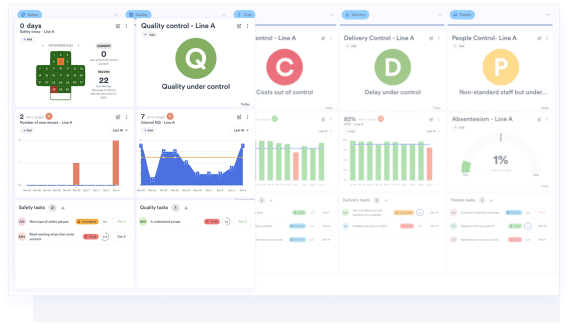
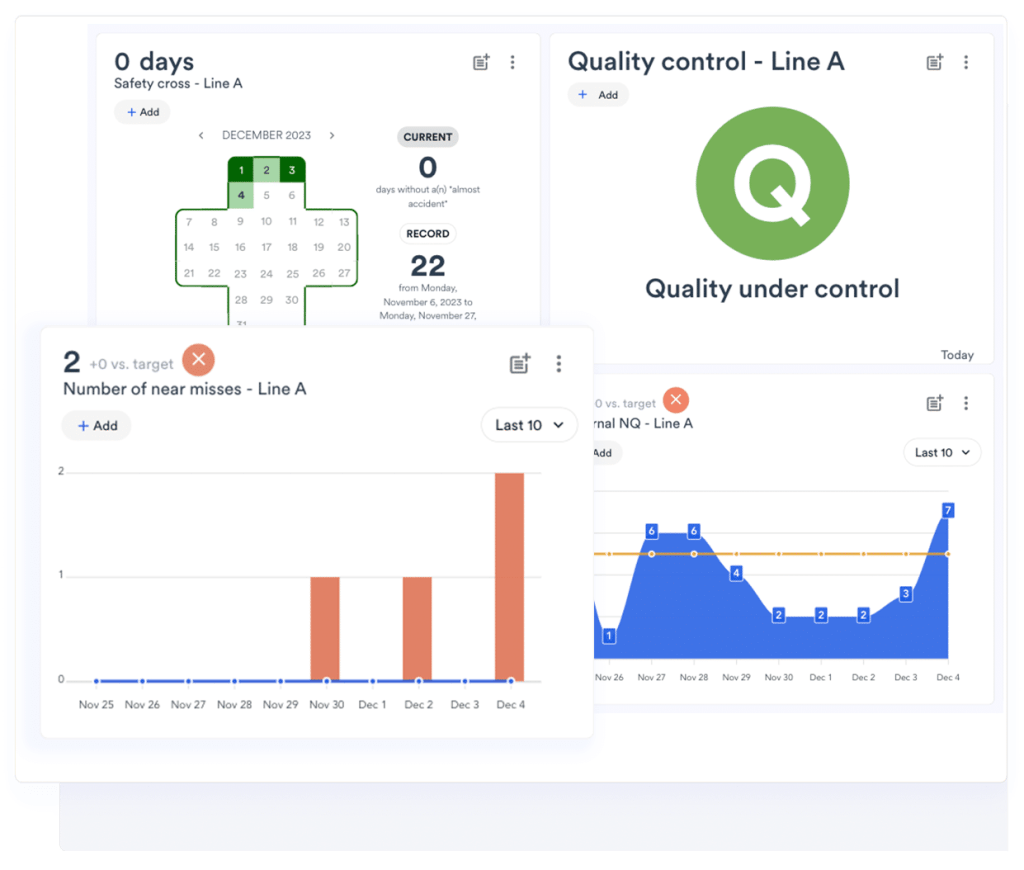
The different types of indicators include the classic format of your indicators on the shop floor (SQCDP), with the ability to customize display modes and colors. Safety crosses, bar charts, line charts, status indicators: iFrame indicators also enable you to embed charts from your BI tools.
Consolidate indicator data on several levels
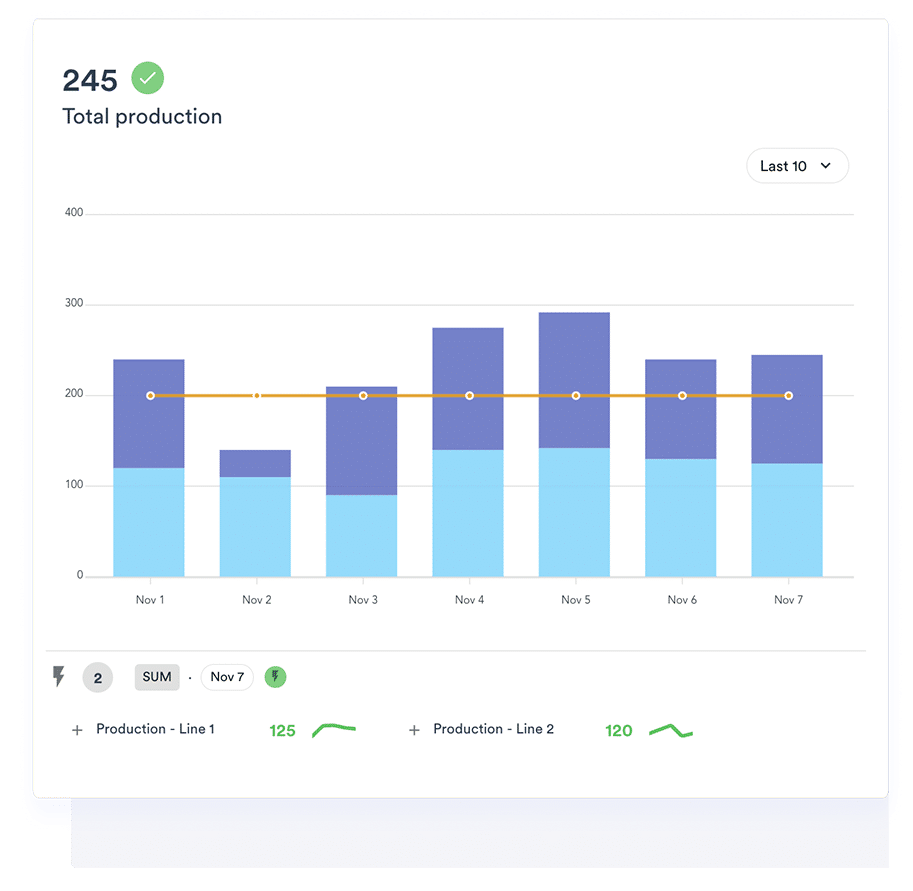
Using Dynamic Indicators (DKPI), you can build a tree structure that consolidates your indicators in real time, giving you a single, reliable dataset and streamlining performance management from the shop floor supervisor to the executive team.
Update your indicator data automatically
With fabriq’s API you can automate indicator updates and save your team leaders valuable time. Connect your tools (MES, ERP, Datawarehouse, etc.) to the API and give more reliable daily visual management to your production teams.


Easily visualize progress on corrective actions in response to performance gaps
If a performance gap arises, you can raise a ticket using the indicator data with just one click and initiate an action plan to correct the deviation or prevent it from recurring. This mirror effect between performance and problem-solving also makes it easier to run performance meetings and monitor actions over time.
What our customers say

David Brevet
Director of Labwater Operations – Merck
“I can quickly log into the solution, take a look at the indicators, and see the actions that may have been decided by the teams. I also have a consolidation of all the production unit’s indicators. Problems are escalated much faster than in the past, which helps us avoid crises at times.”

Steve Desmaret
Production Assembly Supervisor – Poclain
“This digital tool is so efficient that we can add photos and attached files. Site visits allow us to ensure compliance with the standards, so on a daily basis, we can visually identify any deviations and, if there are any, address them.”
Performance indicators in 4 questions:
Can I update my indicators automatically?
Yes, it is possible to connect external sources and update the indicators automatically, either through no-code solutions like Zapier or Power Automate, or by directly using our API.
Can I customize the visualization of my indicators?
The visualization of the indicators is customizable, including options to modify colors and graphs, among other things.
Can I modify the frequency and display period of the data?
You can modify, perform operations on, and consolidate data over time. For example, you can transform an indicator from a daily granularity to a weekly one.
Can I consolidate the data from my indicators and create a KPI tree?
Indicators can be consolidated within Fabriq, allowing you to have indicators that automatically update based on the values of other indicators.
Discover the other features
More efficient teamwork and faster implementation of continuous improvement action points
Bring all the factory’s action plans together in the same tool, so you finally have a single reference point that is common to all your teams.

Digitalize visual management on your shop floor
Say goodbye to static whiteboards. Build dynamic, customized dashboards with all the information you need to run your performance meetings or communicate with your shop floor staff.

View all your shop floor performance indicators in the same tool
You can access the latest indicator (KPI) updates to ensure effective monitoring and rapid response to performance gaps, from your smartphone, computer or screens on the shop floor.

Centralize communication to your shop floor teams
Thanks to Fabriq’s communication feature, you are sure to pass on all key information to your teams at your daily shop floor meetings.

Carry your factory in your pocket, thanks to the Fabriq app (Iphone & ios)
A simplified cell phone interface designed for use by operators on the field to detect and raise issues, defects, or performance gaps.

Measure your operational excellence indicators and improve your system
Capitalize on the operational excellence data in fabriq with powerful search and analysis features so you can leverage the value of the data that guides your teams.

Discover our latest articles

5 Lessons in Lean Daily Management from MDMES

What Is Knowledge Management? A Guide for Factories
